MIT ID Reader
Background
MIT’s 6.002, Circuits and Electronics, has a lab where they teach students how to build a radio circuit to read their ID cards. Since I took the class in the fall of 2017, the circuit design has changed and the instructors now include software that can read and display the binary card data. When I took the class this didn’t exist so I built my own reader. It’s a significantly different approach than what the class uses, but my design uses far less parts - and I designed the entire project from the ground up. I built this in the summer of 2018 in between research projects and my work with MIT EMS.
Circuit Details
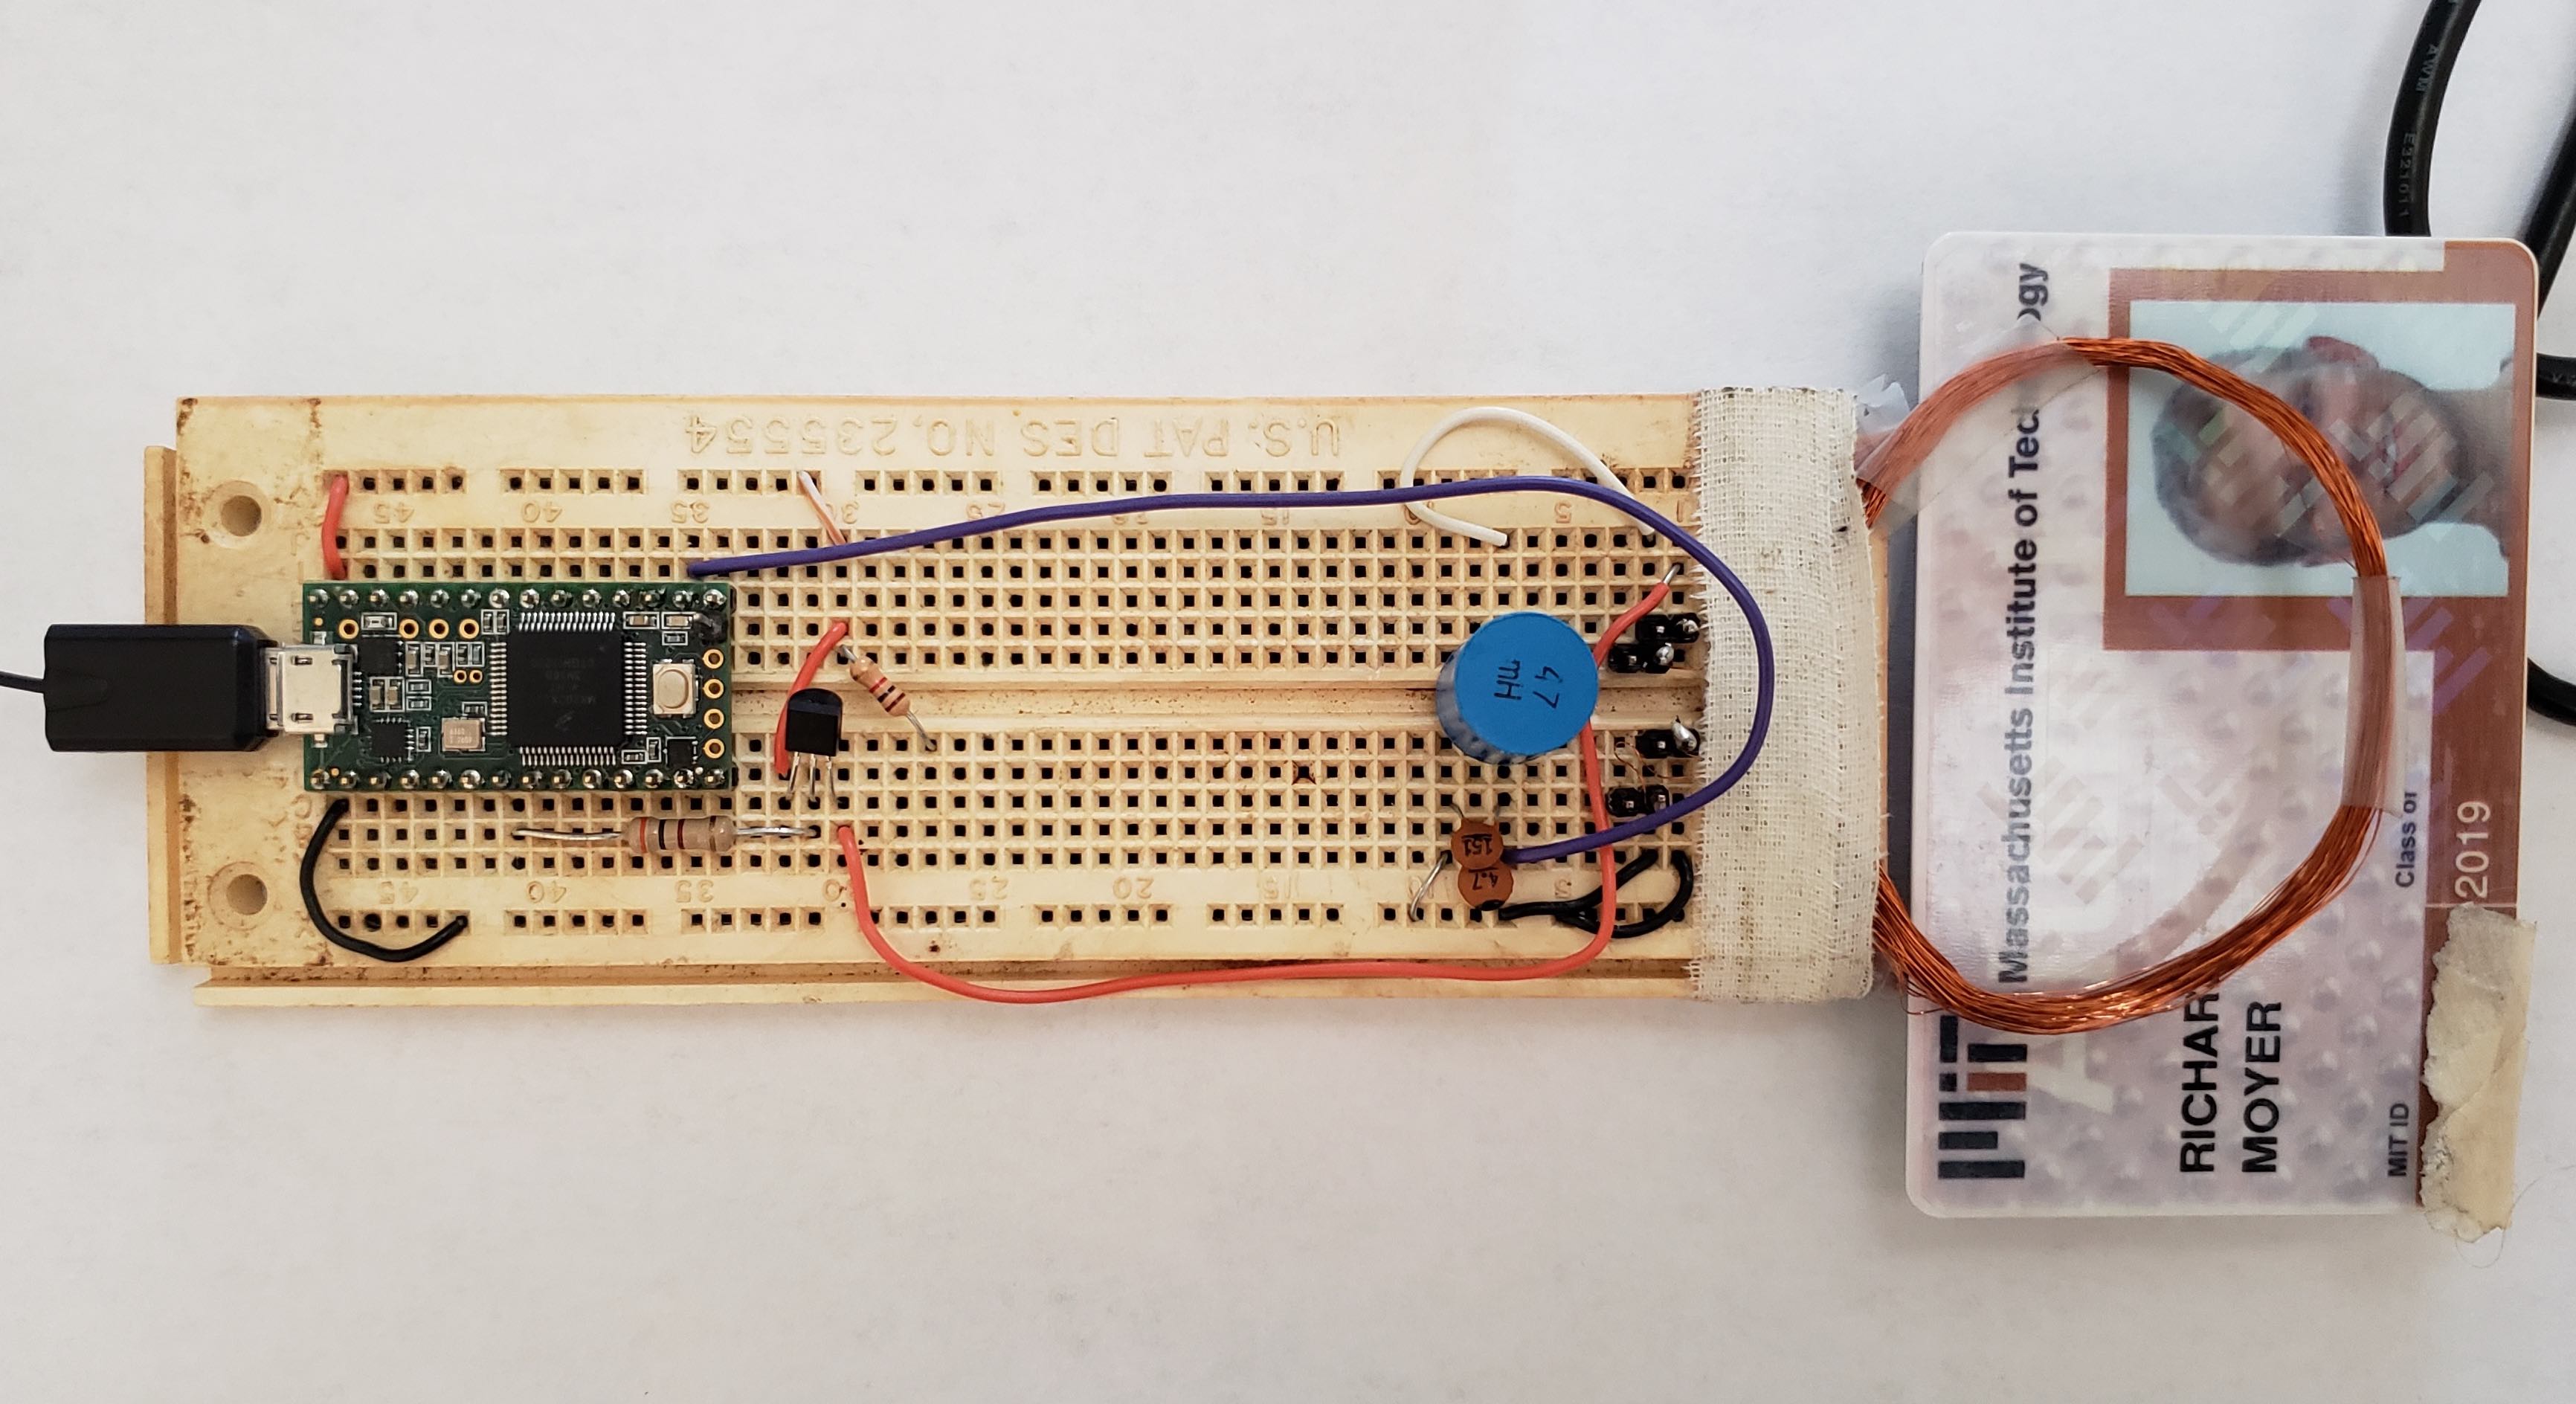
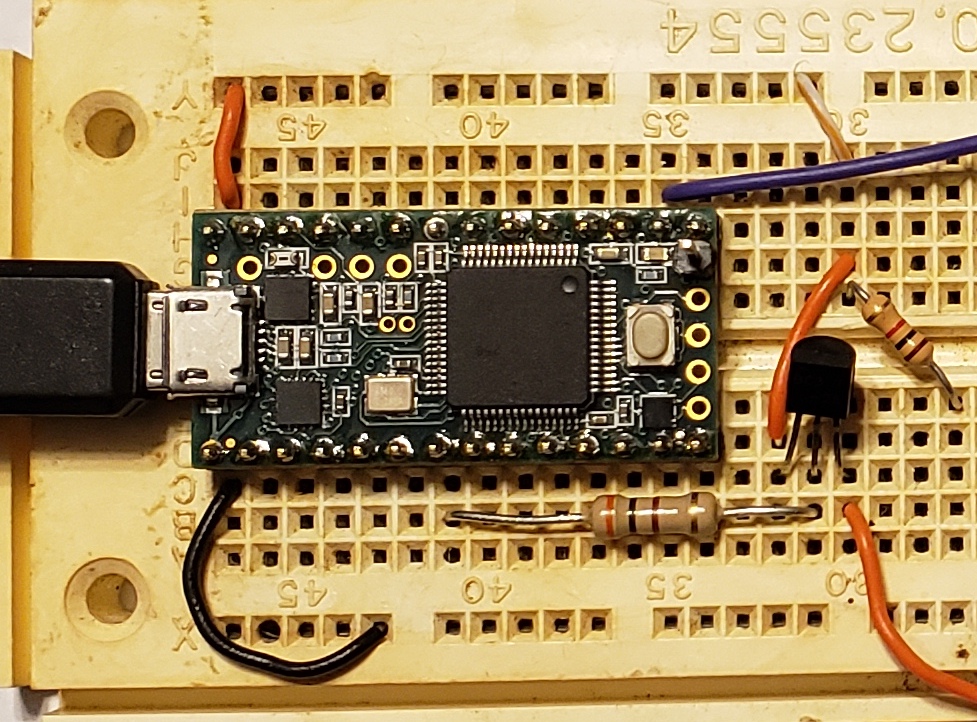
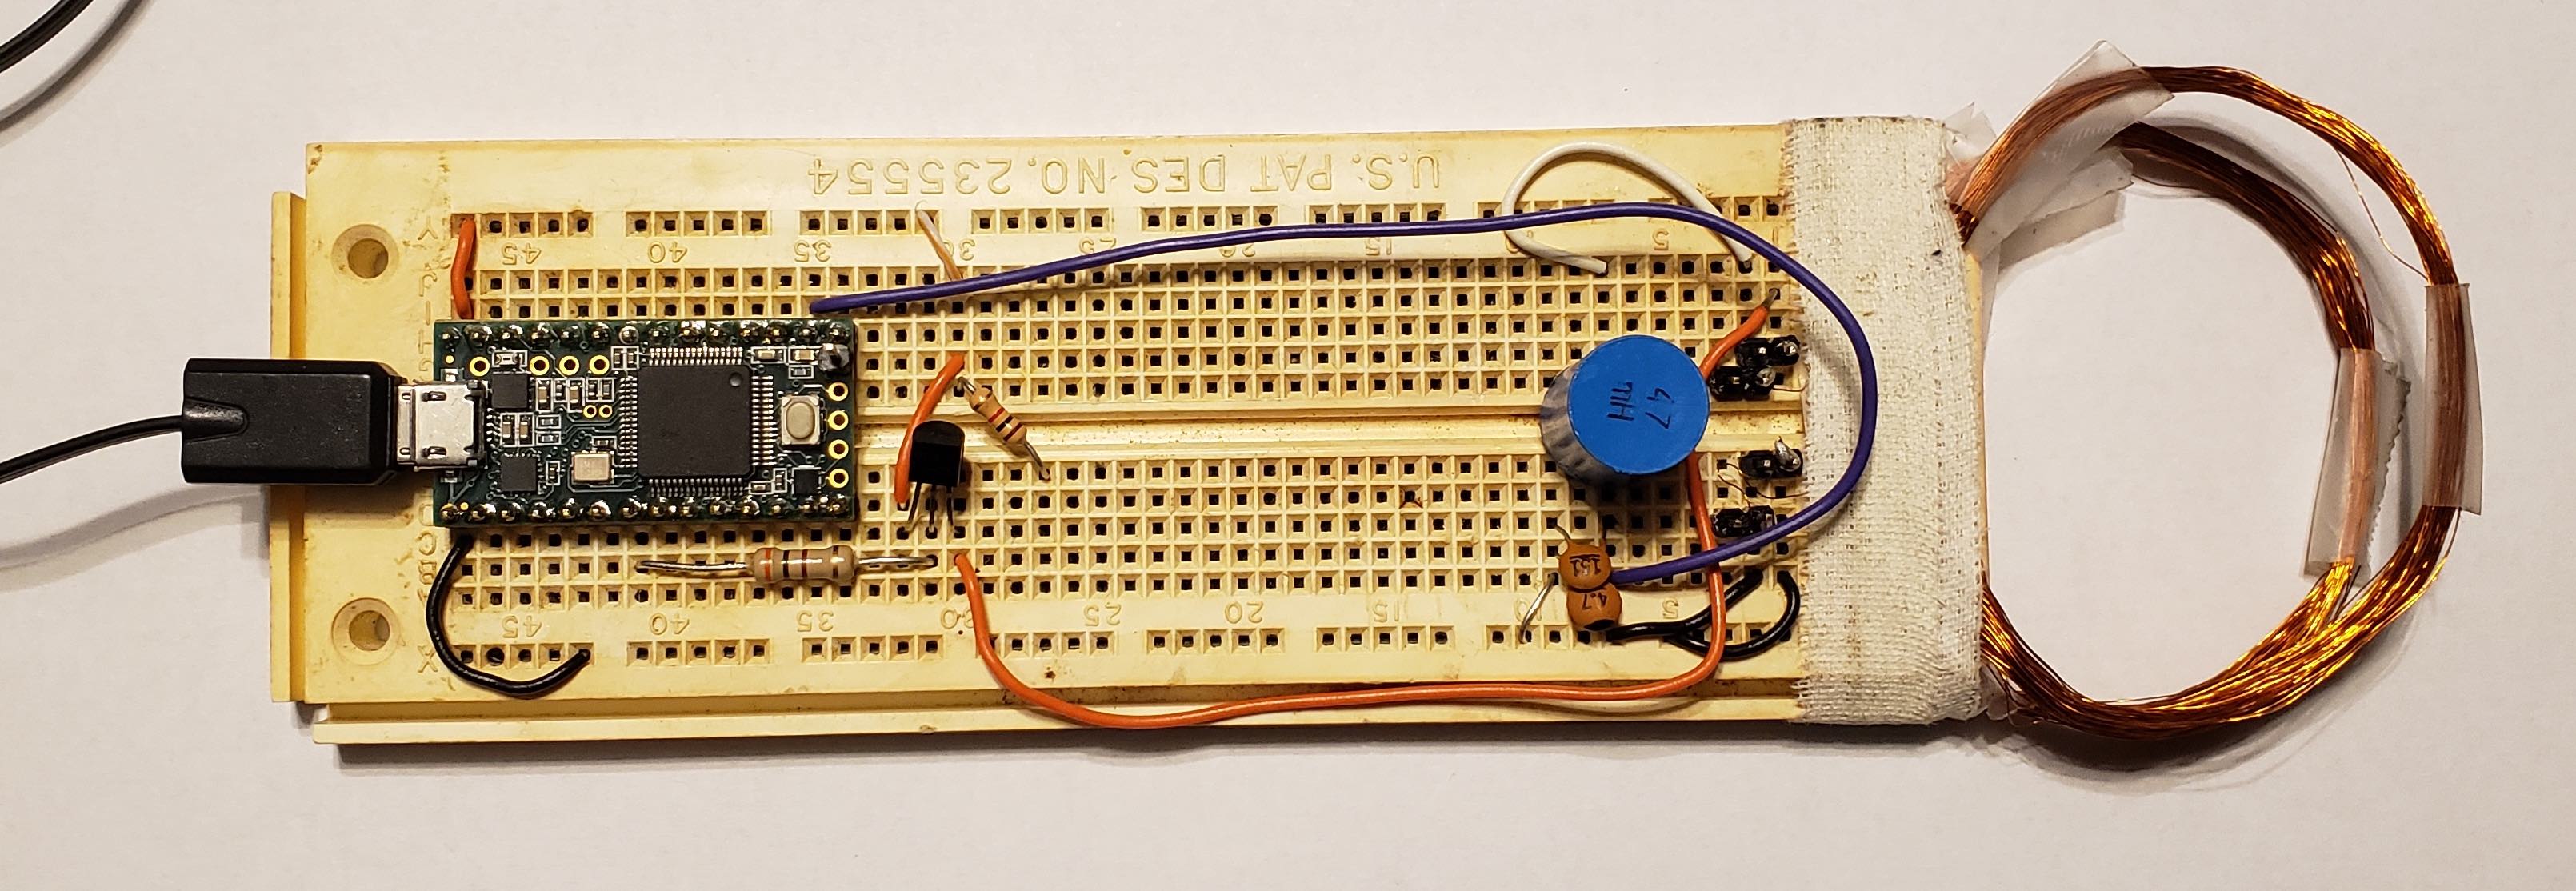
MIT ID cards use a nominal 125khz RFID chip that recieves power at 125khz and transmits 1/2 and 3/2 of this drive frequency. Data is transmitted on this 62.5khz signal using phase shift keying and 16 cycles/bit. To retrieve this data, we can use one coil to send a 125khz signal and a second coil to recieve the combined 125khz and 62.5khz signals. I used a 62.5khz resonant circuit connected to the recieving coil, and connected this to my chip’s analog input for processing. Here’s the full breadboard layout:
Software
Initial plan:
- Capture data at at least twice the carrier frequency, then use signal processing to analyze this
- Exactly twice the carrier frequency may not capture the wave, so I probably need 4 samples/cycle to accurately reproduce it
- Sampling with an Arduino at 250khz is hard, the base data rate for the ADC is 15.6 khz, due to the ADC reading time. Additionally, we quickly run out of memory for 4 samples/cycle x 16 cycles/bit x 224 bits/sample
Also, our data is noisy and I would have to figure out how to digitally process this signal from scratch.
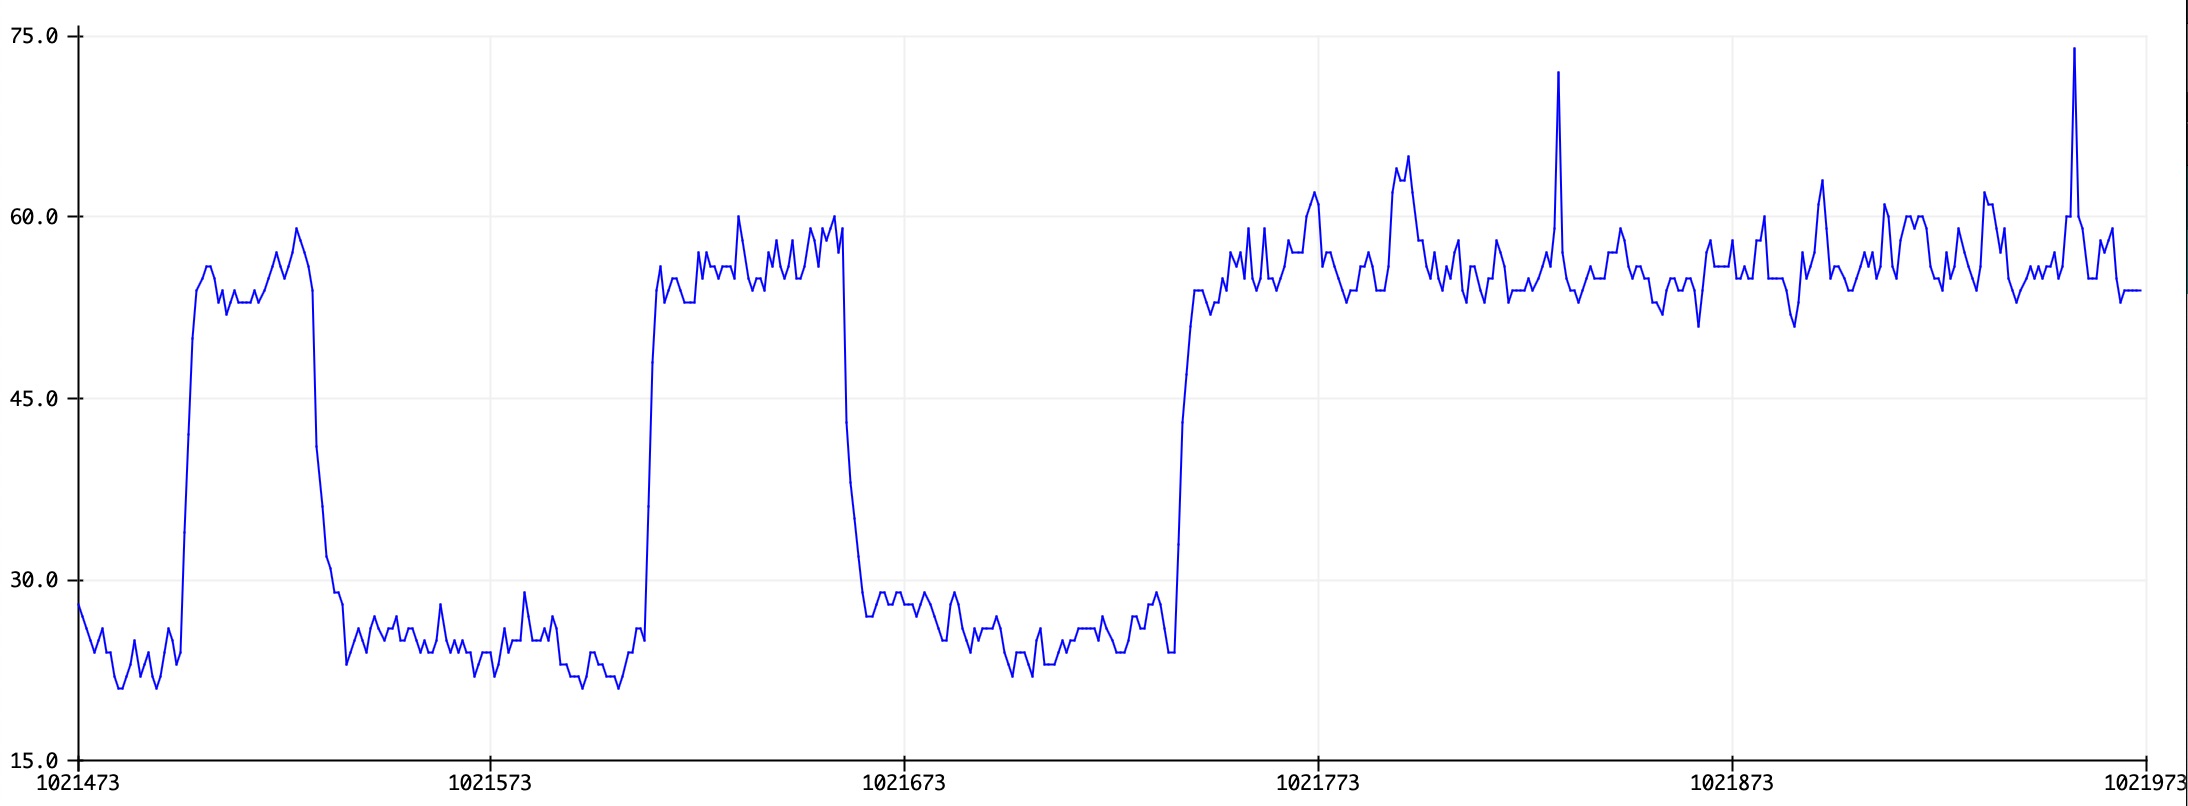
However, I realized that if we provide the driving 125khz signal from our microchip, we can predict exactly when the peaks and valleys of the recieved signal are, and just sample at this one point in time. A high voltage for any sample indicates one bit, and a low voltage indicates the other, as the signal sine wave has been phase shifted by 180º (The 1’s and 0’s are initially ambiguious since they invert if the card is reversed, but fortunately this is easy to fix when the signal is processed)
This was then implemented to gather 20,000 samples, which allowed me to record the card data string about 5 times. In order to sample each peak fast enough and to store all this data, I switched from an Arduino to a Teensy 3.2 I had on hand. Here’s a sample waveform that the Teensy sent back to my computer:
Data Processing
Once we have analog measurements at each wave peak, converting this into binary data is simple:
- Compute the average of the voltage readings
- Iterate through the stored data elements, assigning a 0 to any voltage less than the average, and a 1 to any voltage greater than the average
- The start bits are a string of 30 0’s. Find these, remembering that there is 16 data points per bit and the data may need to be inverted.
- Sample every 16 points thereafter to read off the card data
I originally sent the raw data from my chip to my computer and processed this all in Matlab, but it can be done on the chip itself, or with a number of other software program.
Future
I wanted to be able to write this to a chip so I could have a copy of my card in my phone case or my watch - however, the complexity of writing this data to a chip is much higher than just reading it and I ran out of time before the summer ended. The code for this project is available on github.